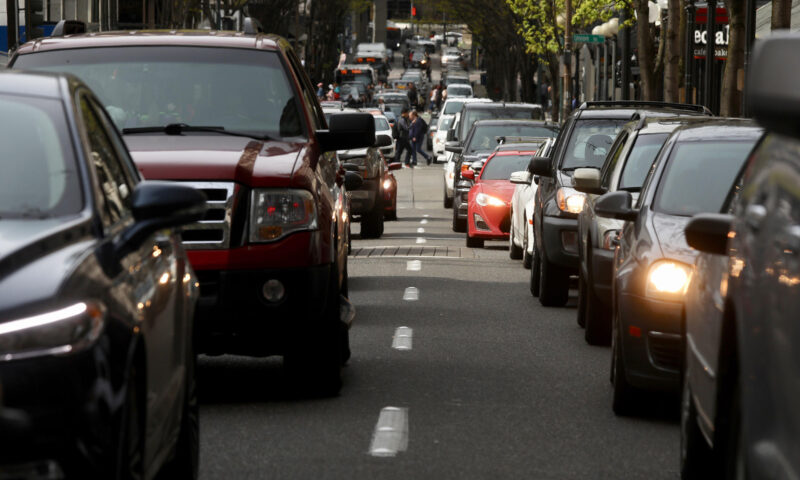
(Pictured: Seattle-Tacoma motorists face an average rush-hour speed of 21 miles per hour–one of the worse in the U.S., according to a national study. Photo credit: Cascade PBS Newsroom)
Just how bad is the traffic around here?
The most congested cities across America – ones where 17 miles an hour is the average speed during rush hours — have been revealed in a recent study, and the Seattle-Tacoma metro area is one of the 10 worst, slogging along at number 7.
With an average rush-hour speed of 21 miles per hour, a little better than the national mark, Seattle-Tacoma has some of the most jam-packed roads in America, according to the study by Stressfreecarrental.com
New York City motorists have it the worst, travelling at an average of just 12 mph during peak drive hours. Motorists in Washington, D.C. and San Francisco are the second and third worst-off, respectively, at 14 and 15 mph. The rest of the top (or should that be bottom?) 10 are Boston, Chicago, Baltimore, Philadelphia, Pittsburgh, and Miami.
The study, unsurprisingly, concludes that drivers are experiencing slow-moving traffic every day.
“As the U.S. tries to improve its air quality, pollution, and reduction of emissions, we need to help traffic flow more freely,” a study spokesman said. “This might involve pumping more funding into improving roads and public transportation to tackle the issue.”
More roads and highways may not be the solution. A phenomenon of “induced roadway demand” was first noticed in the 1930s, most dramatically in New York City, where “master builder” Robert Moses presided over a massive program of parkway and bridge construction. Each new project was necessary, it seemed, to alleviate traffic congestion. And yet, soon enough, the new roads were just as clogged as the old.
The opposite is true, too — call it reduced demand. You might imagine that cutting road capacity would lead to more traffic jams. Indeed, whenever a highway, road or bridge closure is planned, predictions of “carmaggedon” inevitably ensue. But that’s not what actually happens. Instead, traffic congestion is often no worse than before. Sometimes it even improves.
It turns out that more roads cause more driving. This may be counterintuitive, but the effect has been thoroughly documented. The new “generated traffic” doesn’t appear all at once; it can take several years. But the more congested an urban area already is, the faster new roads will fill up. And all this increased driving can’t simply be attributed to growing population. Road expansion leads to more vehicle miles traveled per capita. That also means more greenhouse gas emissions pumped into the atmosphere.
But how much more?
There’s a tool to help answer that question. The Rocky Mountain Institute, an international organization focused on decarbonizing energy systems, launched an Induced Travel Calculator for the United States. You choose your state, urban area, road type, and the number of lane miles a proposed project would add. The calculator tells how many vehicle miles and metric tons of emissions will result once the generated traffic effect sets in.
For example: Twenty new lane miles of interstate highway in the Seattle area will generate 103 million to 155 million additional vehicle miles traveled annually, which would burn about 7 million gallons of gas. By 2050, the cumulative direct emissions produced by this stretch of roadway would total between half a million and 1 million metric tons of carbon dioxide. That range is important. The upper end represents business as usual. The lower end represents a scenario aligned with achieving the U.S. Nationally Determined Contribution under the Paris Agreement, including “100 percent electrification of new passenger vehicles by 2035 and rapid renewable power development,” according to the calculator’s methodology.
In other words, even with an ambitious timeline for vehicle electrification and clean energy, we just can’t keep building new highways and expect to reduce emissions. That hard truth is what inspired the calculator.
“We’ve aligned the strategy of our work around the Intergovernmental Panel on Climate Change’s 1.5 degrees Celsius carbon budget,” said Ben Holland, a manager for the Rocky Mountain Institute. “We came to this realization that even if we put 70 million electric vehicles on the road by 2030, we’d still have to reduce vehicle miles traveled by 20 percent.”
“Nothing prevents the states from doing the right thing and distributing more funds to cities for transit and building complete streets,” said Holland. “But history suggests that states tend to funnel that money into regional highway projects, of which most are expansions and not repairs.”
Washington has a poor track record when it comes to making these kinds of decisions. According to analysis by the Washington Post, Washington is “the eighth worst in the country for its share of roads in poor condition, at 27 percent. At the same time, more than three-fourths of the state’s spending on roads went toward expansion — fourth-highest in the nation.”
Holland hopes the Induced Travel Calculator will help advocates at the state and local levels educate lawmakers and influence the distribution of transportation funds.
Andrew Kidde, transportation team lead at the climate action group 350 Washington, wants to do just that. He noted the Washington Legislature has considered “these things without any information about vehicle miles traveled and greenhouse gas impacts. “Why do you have targets if you’re not going to measure what your projects do?”
Suppose the Legislature could muster the will to stop building new highways. What should it fund instead?
That’s an easy question for Abby Griffith to answer: Public transit, and not just for the most urbanized areas. Griffith grew up in rural Ridgefield, 15 miles outside of Vancouver, where she now lives in low-income housing near the edge of the city.
“Downtown there’s a lot of buses, there’s options, but for people like me there’s no way I could afford to live in downtown Vancouver,” said Griffith, who’s blind and depends on the transit system to get around. “Sometimes it takes me an hour to get to the store, especially if I have to transfer. If we had a transportation system that works, a lot more low-income or disabled people could get jobs.”
Upending the highway-heavy status quo won’t be easy. There’s political pressure from the corporations that profit from new highway construction and car dependence; trade unions whose members build new highways; and constituents who believe that expansions will ease congestion. There’s also the state constitution, which restricts the expenditure of gas tax revenues to “highway purposes.”
“The highways have been expanded ever since Robert Moses got his hands on Long Island,” said Kidde. “It generates its own next stage, because you’ve always got one community or another complaining, or you’ve invested $5 million into the engineering and no one wants to say we’re abandoning that. It just keeps going. There’s no good time to stop. Let’s stop now.”
Sources: Cascade PBS newsroom, previously known as Crosscut, a non-profit news site covering the Pacific Northwest, and StressFreeCarRental.com, a website for information on car rentals and related topics, contributed to this report.